
 International Journal of Pharmaceutics 186 (1999) 119 – 125
A compartmental absorption and transit model for
a Glaxo Wellcome Inc., Fi6e Moore Dri6e, Research Triangle Park, NC 27709, USA
b College of Pharmacy, The Uni6ersity of Michigan, Ann Arbor, MI 48109, USA
Received 2 November 1998; received in revised form 16 April 1999; accepted 19 April 1999
Abstract
International Journal of Pharmaceutics 186 (1999) 119 – 125
A compartmental absorption and transit model for
a Glaxo Wellcome Inc., Fi6e Moore Dri6e, Research Triangle Park, NC 27709, USA
b College of Pharmacy, The Uni6ersity of Michigan, Ann Arbor, MI 48109, USA
Received 2 November 1998; received in revised form 16 April 1999; accepted 19 April 1999
Abstract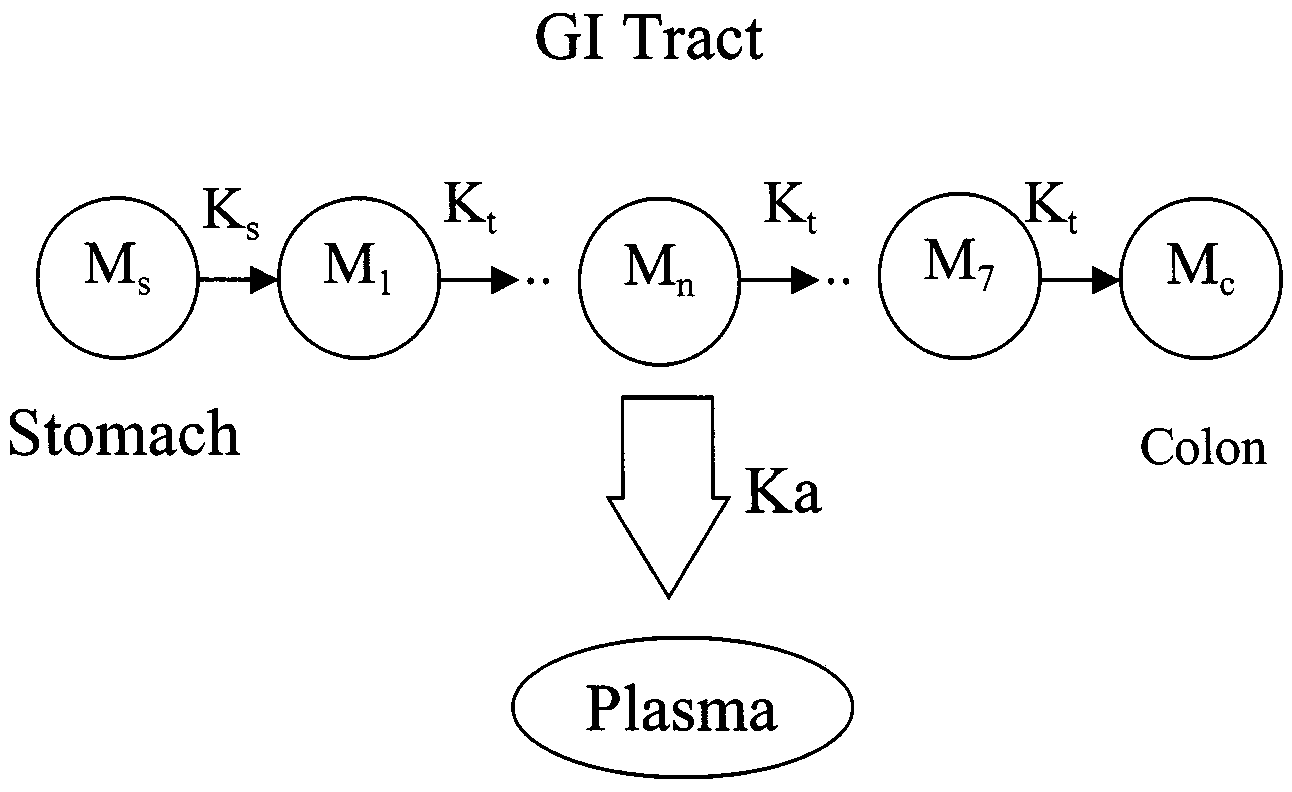 L.X. Yu, G.L. Amidon / International Journal of Pharmaceutics 186 (1999) 119 – 125
effect of gastric emptying on plasma concentra-
2. Theoretical
L.X. Yu, G.L. Amidon / International Journal of Pharmaceutics 186 (1999) 119 – 125
effect of gastric emptying on plasma concentra-
2. Theoretical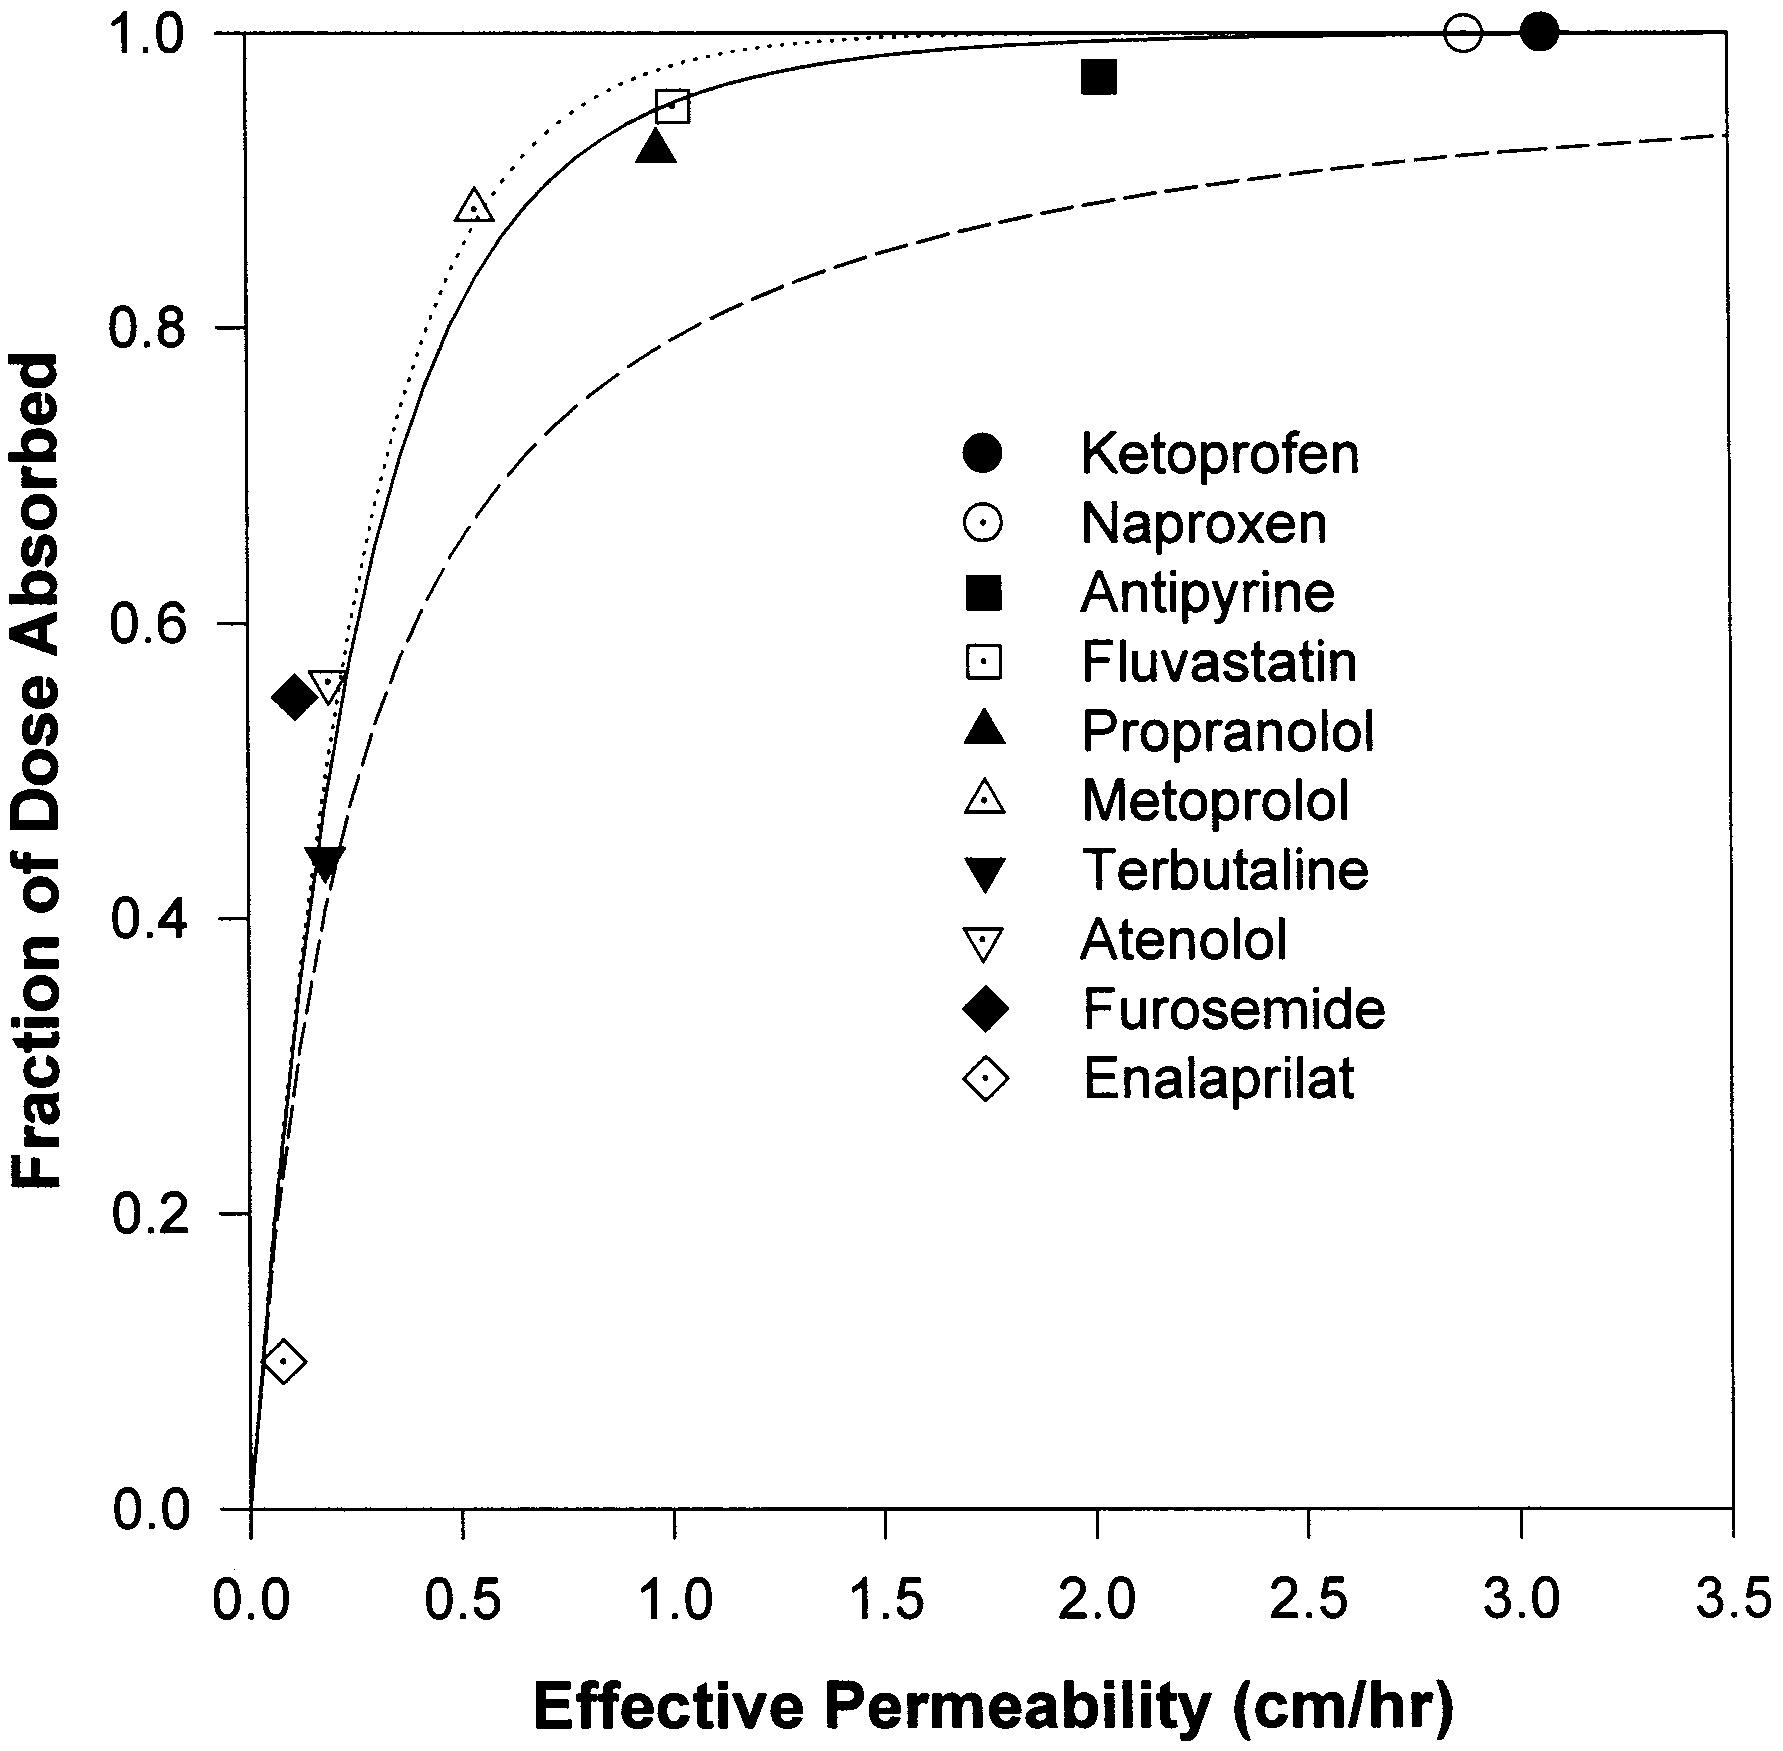 L.X. Yu, G.L. Amidon / International Journal of Pharmaceutics 186 (1999) 119 – 125
dicted fraction of dose absorbed is 34%, slightly
Summary of the literature data of permeability and fraction of
below the experimental observations. The model
predicted the fraction dose absorbed to be 48, 50,
84, and 95% for terbutaline, atenolol, metoprolol,
and propranolol, respectively, based on the per-
meability data. The predicted results are in agree-
ment with the experimental data (Paterson et al.,
1970; Mason et al., 1979; Davies, 1984; Benet et
al., 1996; American Hospital Formulary Service,
1998). Fluvastatin, antipyrine, naproxen, and ke-
toprofen are completely absorbed (Eichelbaum et
al., 1982; Benet et al., 1996; Tse et al., 1992), as
4.2. Estimating the rate of drug absorption
Fig. 3 gives the theoretical prediction (dotted
lines) for rate of drug absorption, based on mono-
exponential gastric emptying and the mean gastric
residence time of 0.25 h for all three doses. The
theoretical prediction is in fair agreement with the
experimental data. The double peaks in the exper-
a The oral bioavailability metoprolol is about 38% (Benet et
imental plasma concentration profiles would not
al., 1996). After oral dose, about 50% of dose appears to
be expected from the simulation, however. Mason
undergo first-pass metabolism in the liver (AHFS Drug Infor-mation, 1998, pp. 1369). Thus, the fraction of dose is about0.88.
L.X. Yu, G.L. Amidon / International Journal of Pharmaceutics 186 (1999) 119 – 125
dicted fraction of dose absorbed is 34%, slightly
Summary of the literature data of permeability and fraction of
below the experimental observations. The model
predicted the fraction dose absorbed to be 48, 50,
84, and 95% for terbutaline, atenolol, metoprolol,
and propranolol, respectively, based on the per-
meability data. The predicted results are in agree-
ment with the experimental data (Paterson et al.,
1970; Mason et al., 1979; Davies, 1984; Benet et
al., 1996; American Hospital Formulary Service,
1998). Fluvastatin, antipyrine, naproxen, and ke-
toprofen are completely absorbed (Eichelbaum et
al., 1982; Benet et al., 1996; Tse et al., 1992), as
4.2. Estimating the rate of drug absorption
Fig. 3 gives the theoretical prediction (dotted
lines) for rate of drug absorption, based on mono-
exponential gastric emptying and the mean gastric
residence time of 0.25 h for all three doses. The
theoretical prediction is in fair agreement with the
experimental data. The double peaks in the exper-
a The oral bioavailability metoprolol is about 38% (Benet et
imental plasma concentration profiles would not
al., 1996). After oral dose, about 50% of dose appears to
be expected from the simulation, however. Mason
undergo first-pass metabolism in the liver (AHFS Drug Infor-mation, 1998, pp. 1369). Thus, the fraction of dose is about0.88.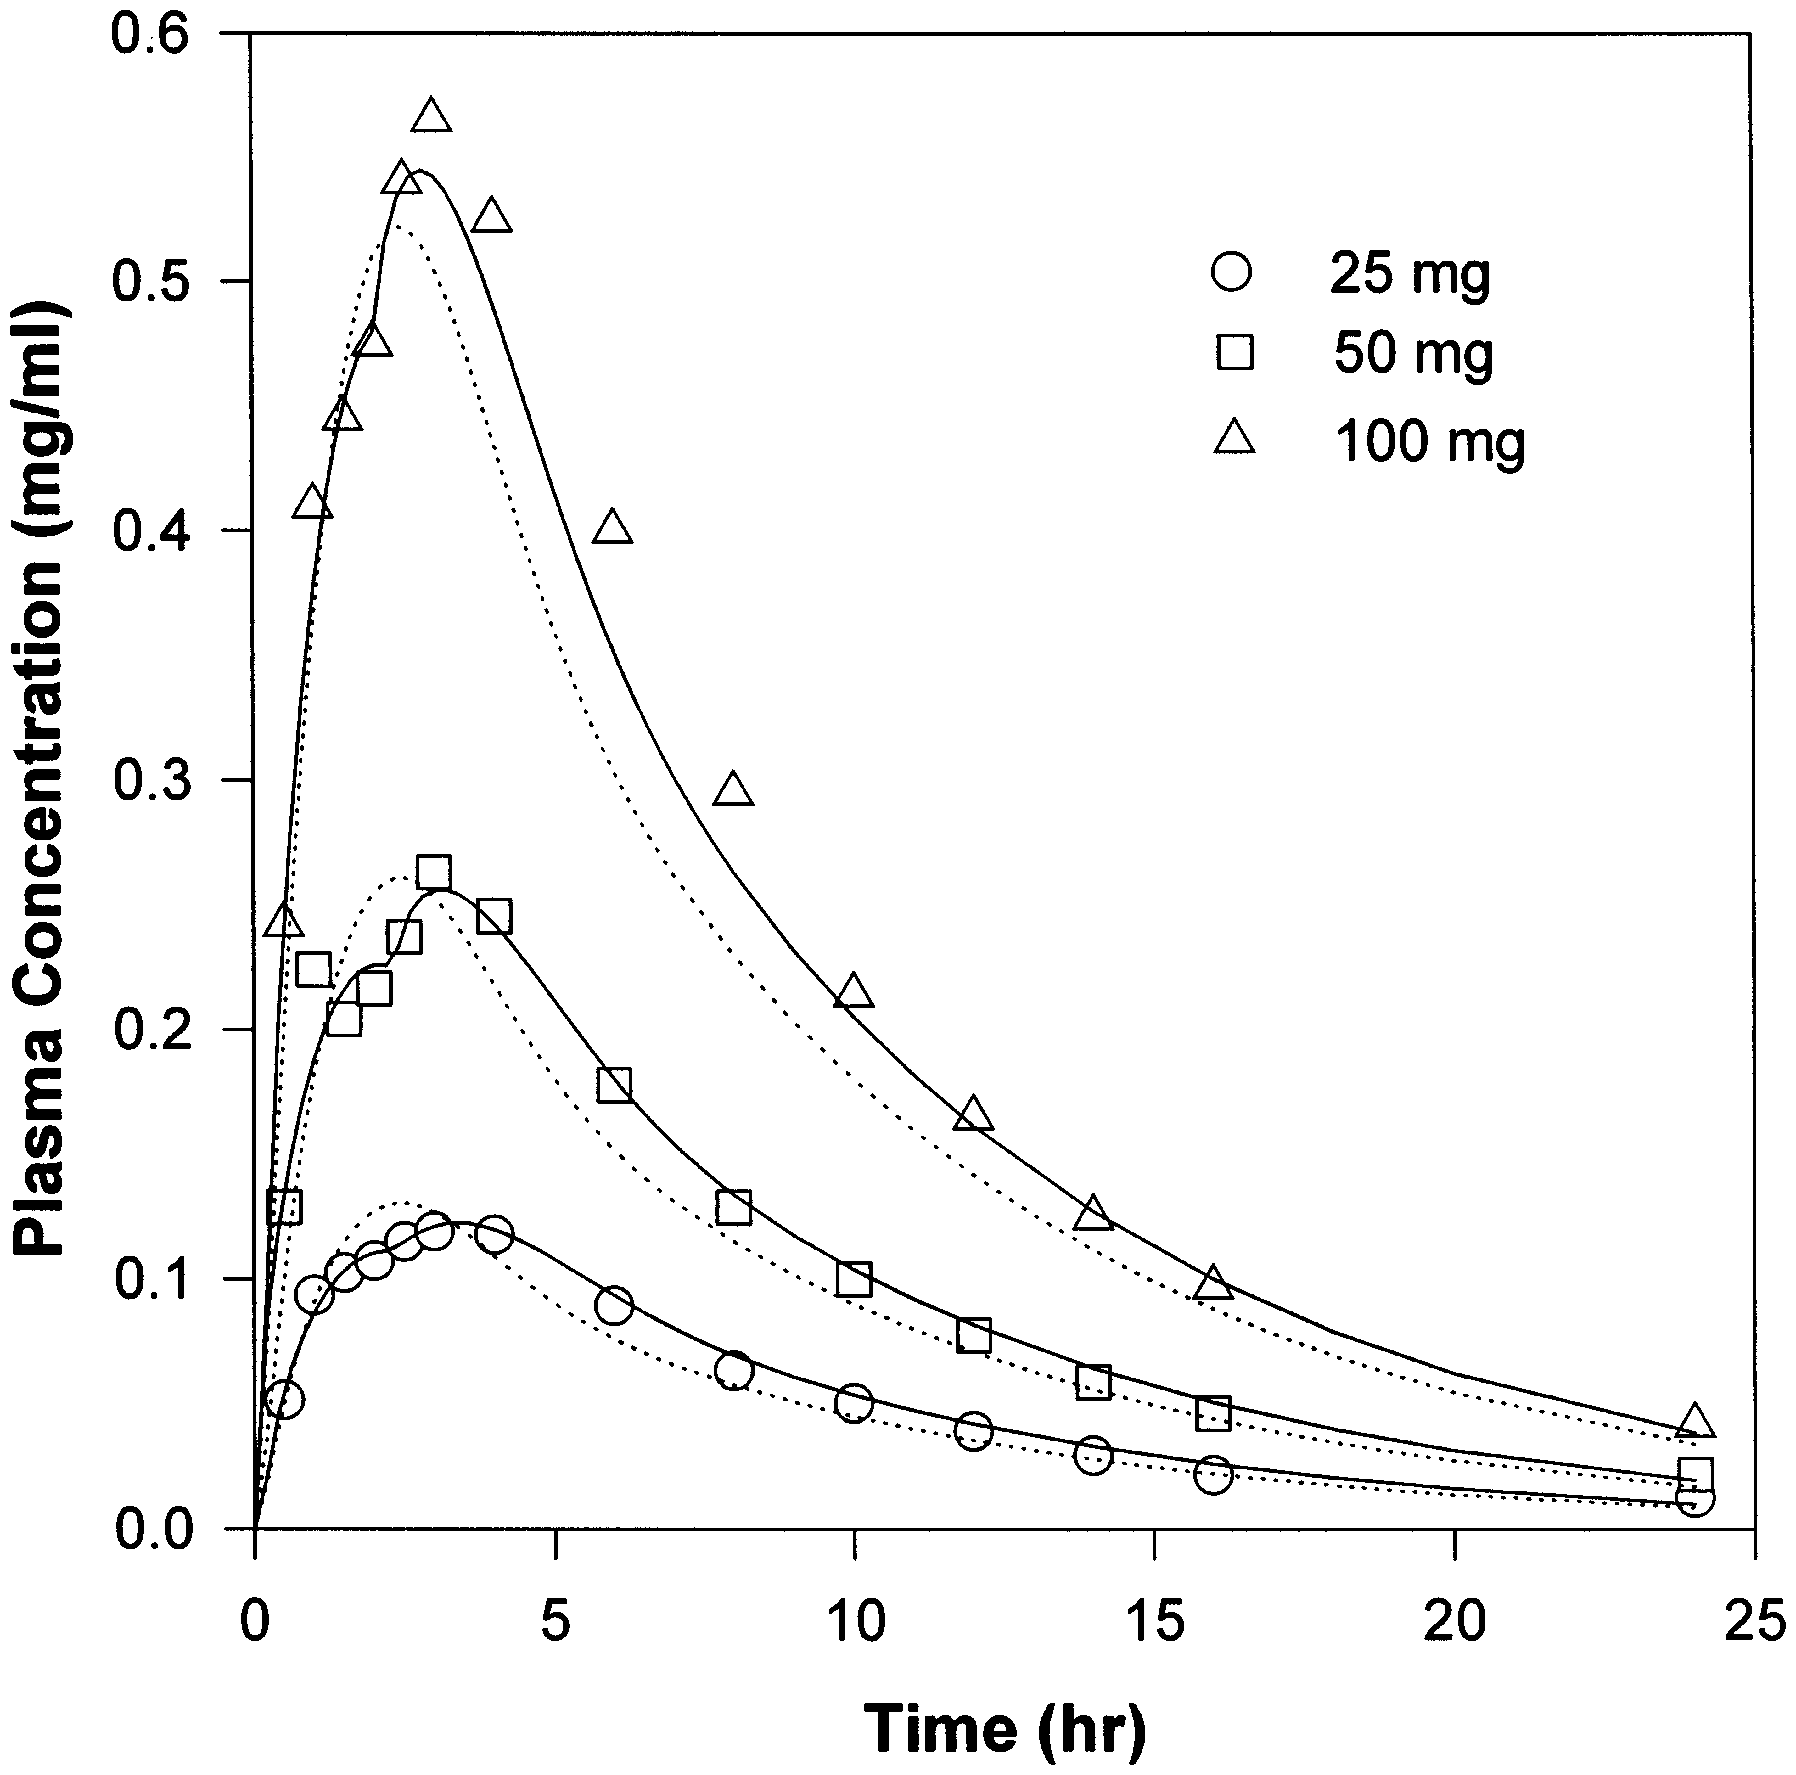 L.X. Yu, G.L. Amidon / International Journal of Pharmaceutics 186 (1999) 119 – 125
almost two hours of no emptying. The remainingdrug was completely cleared from the stomach inthe second phase of the emptying, producing thesecond peak in the plasma concentration profile.
L.X. Yu, G.L. Amidon / International Journal of Pharmaceutics 186 (1999) 119 – 125
almost two hours of no emptying. The remainingdrug was completely cleared from the stomach inthe second phase of the emptying, producing thesecond peak in the plasma concentration profile.chrystadelfianie.pl
Michael Guest. The harmony of the Gospels This aspect of fullness and the very special position of Jesus in this respect is revealed to us by Paul when writing to the Colossians: READ COLOSSIANS 1: v18 The question is sometimes asked: Why do the Gospel records differ in This complete body: Jesus with his saints, was symbolised to John in varying ways. Why are some quite important hap