Ordered, immediately called back and the same day delivered the order.Very pleased with the work. Thank you for prompt and accurate work https://africarx.co.za/buy-levitra-south-africa.html great prices, delivered on the day of the order. Pleasant managers consult by phone.
Microsoft word - physiology 435, lab 601, group 3.doc
Effects of Caffeine on Cardiac and Skeletal Muscle Stimulation: A Non-
invasive Study Based on a Single Dose of Caffeine
Kira Arno, Logan Schlosser, Chris Boyd, Aleisha Gardner
Abstract
According to previous research, caffeine is a known stimulant, which affects the nervous
system through interactions with both A1 and A2A adenosine receptors as a competitive antagonist.
The objective of this experiment was to analyze the physiological effects resulting from average
daily caffeine consumption. We measured changes in reaction time, blood pressure, heart rate, and
muscle activity after consuming a single dose of either a caffeinated or non-caffeinated beverage
were measured. Females who consumed the caffeinated beverage showed a significant decrease in
the QRS complex duration in the ECG compared to the control, indicating that the heart changed
pace while consuming caffeine, no such difference was seen in males. For males, ECG amplitude,
for the caffeinated group, was significantly increased compared to the control, possibly indicating
increased heart contraction as a result of caffeine consumption, no difference was seen in the female
groups. The average changes in blood pressure, as well as average value of a resting muscle(in mV)
and peak-to-peak difference during a contraction, show that there is an overlap in the standard error
ranges for either males or females. This indicates that there is no significant difference between
caffeine and non-caffeine groups for these measured values.
Introduction
Caffeine is one of the most popular and well known stimulants used by man today. It is
found in many different beverages including soda, coffee, and energy drinks as well as in other
foods. This means that caffeine is used daily by millions of people which makes understanding its
affects very important. Caffeine is known to affect many different physiological functions in
humans including heart rate, body temperature, blood pressure, and locomotion. 2,3,4 Caffeine has
also been know to have affects on cognitive abilities as well, including increased alertness and
arousal, as well as decreased reaction time, better concentration and increased energy. 1,3 In terms
of pharmacological effects, caffeine is very similar to other classical psychostimulants including
cocaine and amphetamine. One of the similarities of caffeine to these drugs is a reinforcing effect
caused by the feelings of well being that these drugs can provide.2 This is the reason caffeine, when
consumed on a regular basis, can become very addicting. With increased use of caffeine around the
world, understanding the addictive effects of caffeine has become an important topic of research.
This research has lead to an understanding of the physiological mechanisms of caffeine’s effects.
Caffeine is capable of interacting with both A1 and A2A adenosine receptors, which function
as mediators of adenosine in the brain, located throughout the body including the forebrain and
hypothalamus.1 The effect caffeine has on muscle activity results from modulation of A1 receptors
located in the forebrain and A2A receptors located in the hypothalamus.1 Caffeine’s structural
similarity to adenosine and adenine allows caffeine to act as a non-selective, competitive antagonist
at both the A1 and A2A receptors. Through competitive binding and blocking of adenosine receptors
in the brain, caffeine is capable of affecting the release of dopamine.1 This is because A1 and A2A
adenosine production plays a modulating role in dopaminergic neurotransmission due to the
reciprocal antagonist allosteric interaction between the A2A adenosine receptor and D2 dopamine
receptor hetromer. As a result, stimulation of adenosine receptors modulates dopamine receptors in
an antagonistic matter.1 Thus, caffeine is capable of counteracting the inhibitory affects of
adenosine- activation of the adenosine receptors on dopamine receptors, which generating a
significant increase in extracellular concentrations of dopamine. These interactions, which lead to
the increased production of dopamine, results in the arousing affects of caffeine.1
In addition to the information about the mechanism of caffeine action on the body,
considerable research has been done to determine the exact physiological effects of caffeine.
Previous studies have already shown that caffeine can have a great impact on the cardiovascular
system by causing increased heart rate and blood pressure which results in increased cardiac
output.3 Other studies indicate that increased caffeine consumption can cause decreased blood flow
to the cerebral cortex in non-habitual caffeine users. As well as an increase in oxygen consumption,
and locomotor ability in different subjects.2 Caffeine has also been shown to have varying affects
on body temperature as well, depending upon the sex of the subject.4 Cognitively, caffeine
consumption causes increased arousal in subjects as well as noticeably decreased reaction times.3
Thus, caffeine can have a wide range of physiological affects upon many different systems in the
The focus of this experiment is to determine whether a single dose of caffeine (equivalent to
one sixteen ounce soda) affects different physiological characteristics in humans. Based on this
previous data as well as the mechanism of caffeine action, we believe that consumption of even a
single dose of a caffeinated beverage will cause detectable changes in reaction time, cardiac output,
and locomotor ability of test subjects. Specifically, we believe that consumption of caffeine will
cause decreased reaction times, increased heart rates and blood pressures, as well as increased
muscle activities in test subjects. In order to test this hypothesis, test one group will consume a
standard caffeinated beverage and the other test group will consume the same beverage without
caffeine. Reaction time, cardiac output, and locomotor ability will be tested before as well as after
consumption to determine if there is a noticeable affect of caffeine on these physiological
To begin the experiment, each individual took baseline tests in order to establish their
normal physiological parameters. Four different parameters were measured in this experiment
reaction time, blood pressure, heart rate, and muscle activity. For the initial test of reaction time,
subjects took a computerized automated reaction time test which tested their reaction time to a
visual cue, the switching of the colors on a stoplight.5 The average of the five trails was taken. To
determine blood pressure, a standard blood pressure cuff and stethoscope was used with blood
pressure measured once after sitting for about five minutes.
To determine effects on heart rate and motor activity, Biopac software was used. An
electrode was placed on each ankle and one on the right hand wrist. These electrodes were then
connected to the computer. This allowed for the ECG of the individual to be measured and the
measurement lasted for approximately one minute. Changes in heart rate were quantified by
changes in the duration of the QRS complex as well as changes in the QRS complex ECG
amplitude. For the initial test, baseline duration for the QRS complex and baseline ECG amplitude
was taken after the subject had been sitting for at least five minutes. To use Biopac software to test
this, an electrode was placed on each ankle and one on the right hand wrist. These electrodes were
then connected to the computer. This allowed for the ECG of the individual to be measured and the
measurement lasted for approximately one minute. From the resulting ECG, a standard section was
chosen (defined as an area of relatively constant baseline and consistent QRS complex ECG
amplitude). From this standard section, the QRS complex ECG amplitude and the QRS complex
duration was measured from one of the peaks and taken as the baseline.
Changes in motor activity were measured as changes in baseline EMG amplitude as well as
changes in peak to peak EMG amplitude caused by stimulation of the leg. An electrode was placed
at the top of the leg (upper thigh) and two other electrodes were placed on the muscles just above
the knee area. These were then connected to the computer to allow for EMG measurement using
Biopac software. The stimulation used in this experiment was a simple reflex test in which the
patellar tendon was struck with a reflex hammer. The resulting motor activity caused by the reflex
test was the data of interest here. For the initial test, initial baseline EMG amplitude and initial peak
to peak EMG amplitude caused by the reflex test was taken for each subject. The reflex test
stimulation was done approximately five times for each subject (same intensity stimulation) and the
EMG peak with the largest amplitude was analyzed. From this peak, the peak to peak EMG
amplitude was taken and from a flat baseline portion of the EMG, the baseline EMG amplitude was
All four of the measurements above were taken prior to beverage treatment in order to get
baseline readings. After these initial baseline measurements, each subject was unknowingly given
one of two different beverages, either sixteen ounces of caffeinated coca cola or sixteen ounces of
non-caffeinated coca cola. The caffeinated coca cola contained approximately 46 mg of caffeine,
which is a typical amount for an average soda or cup of tea. After consumption of the soda,
subjects were asked to wait fifteen minutes without any other activity before the tests were taken
again. Fifteen minutes was a standard amount of time used in previous experiments in order to
allow the caffeine to produce its full effects upon the subjects.3 After the waiting period, each
subject completed the four tests again. This data was then compared to the original baseline tests in
order to determine any changes that may have been caused by the administration of the treatment.
Systolic Blood Pressure
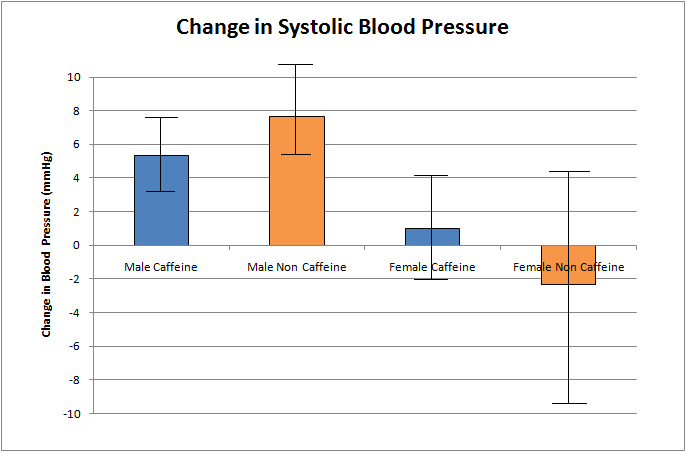
Systolic blood pressure measures the maximum pressure that circulating blood exerts on the
walls of blood vessels. For males in the study that were given caffeine, the average systolic blood
pressure (average of the measured systolic pressures for all males in group, n = 3) before beverage
intake was found to be 119.67 ± 5.49 mmHg (error here and in further calculations is standard error
of the mean, with three subjects each. All further average values represent the average of the
measured values for all subjects in a particular group). After beverage intake, the average systolic
blood pressure was found to be 125.00 ± 3.21 mmHg. The average change in systolic blood
pressure (pressure after intake – pressure before intake, averaged over all subjects) (all further
average changes were calculated in a similar matter for respective values) was found to be 5.33 ±
2.40 mmHg (Figure One). For non-caffeine males, the average systolic blood pressure before
beverage intake was 129.33 ± 6.36 mmHg (n = 3) and after beverage intake was 137.00 ± 5.51
mmHg. The average change in systolic blood pressure was 7.67 ± 3.17 mmHg (Figure One). As
seen in figure one, the standard error ranges overlap for the changes in systolic blood pressure for
caffeine and non-caffeine males indicating no significant difference between the two treatments.
For females in the study that were given caffeine, the average systolic blood pressure before
beverage intake was found to be 116.00 ± 5.85 mmHg (n = 3) and after beverage intake was found
to be 117.00 ± 4.58 mmHg. The average change in systolic blood pressure was 1.00 ± 3.06 mmHg
(Figure One). For non-caffeine females, the average systolic blood pressure before beverage intake
was 126.00 ± 3.06 mmHg (n = 3) and after beverage intake was found to be 123.67 ± 8.41 mmHg.
The average change in systolic blood pressure was -2.33 ± 6.17 mmHg (Figure One). As can be
seen in figure one, the standard error ranges overlap for the changes in systolic blood pressure for
caffeine and non-caffeine females indicating no significant difference between them.
Figure One. Average change in systolic blood pressure for experimental subjects. Each value is based on an average of three replicates (three different subjects, n = 3). Error bars represent ± one standard error.Error bars overlap for caffeine and non-caffeine users in both male and female groups indicating no significant differences.
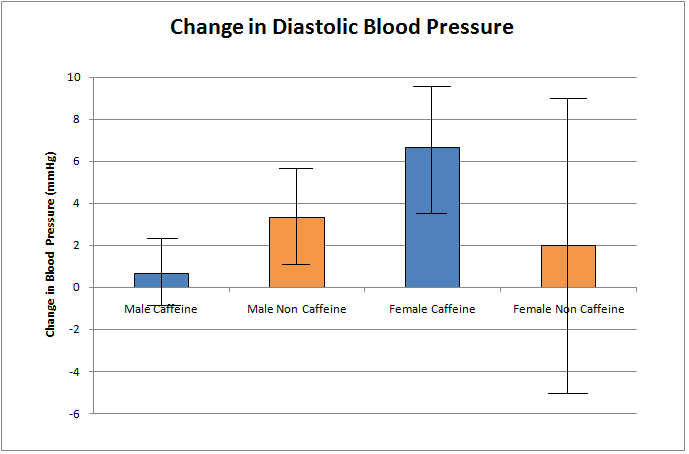
Diastolic Blood Pressure
Diastolic blood pressure measures the minimum pressure that circulating blood exerts on the
walls of blood vessels. For the male caffeine group, average diastolic blood pressure before
beverage intake was found to be 89.33 ± 4.06 mmHg (n = 3) and after beverage intake was found to
be 90.00 ± 5.29 mmHg. The average change in diastolic blood pressure was found to be 0.67 ± 1.76
mmHg (Figure Two). For the non-caffeine male group, the average diastolic blood pressure before
beverage intake was found to be 85.67 ± 3.38 mmHg (n = 3) and after beverage intake was found to
be 89.00 ± 1.53 mmHg. The average change in diastolic blood pressure was found to be 3.33 ± 2.40
mmHg (Figure Two). As seen in figure two, the standard error ranges overlap for the average
changes in systolic blood pressure for caffeine and non-caffeine males, which indicates no
For the female caffeine group, the average diastolic blood pressure before beverage intake
was found to be 84.00 ± 3.46 mmHg (n = 3) and after beverage intake was found to be 90.67 ± 0.67
mmHg. The average change in diastolic blood pressure was found to be 6.67 ± 2.91 mmHg (Figure
Two). For the non-caffeine group, the average diastolic blood pressure before beverage intake was
found to be 91.67 ± 8.17 mmHg (n = 3) and after beverage intake was found to be 93.67 ± 4.33
mmHg. The average change in diastolic blood pressure was found to be 2.00 ± 7.23 mmHg (Figure
Two). As seen in figure two, the standard error ranges overlap for the average changes in diastolic
blood pressure for caffeine and non-caffeine females, which indicates no significant difference
Figure Two. Average change in diastolic blood pressure for experimental subjects. Each value is based on an average of three replicates (three different individuals, n = 3). Error bars represent ± one standard error.Error bars overlap for caffeine and non-caffeine users in both male and female groups indicating no significant differences. Reaction Time
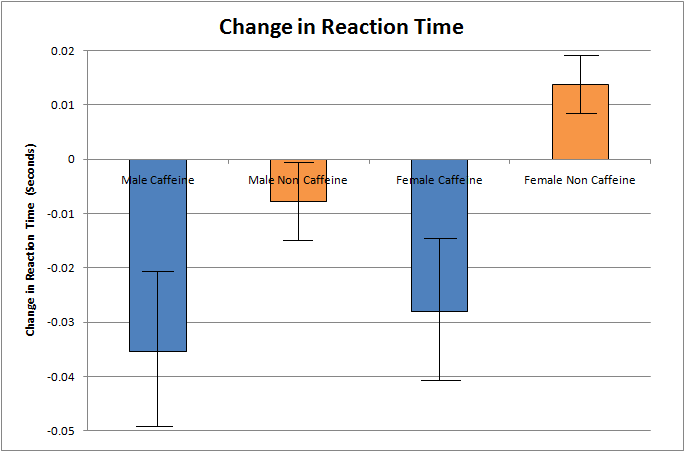
A subject’s reaction time measures how quickly a subject can respond to a stimulus. For the
male caffeine group, the average reaction time before beverage intake was found to be 0.2983 ±
0.0425 seconds (n = 3) and after beverage intake was found to be 0.2630 ± 0.0327 seconds. The
average change in reaction time was found to be -0.0354 ± 0.0144 seconds (Figure Three). For the
male non-caffeine group, the average reaction time before beverage intake was found to be 0.2901 ±
0.0420 seconds (n = 3) and after beverage intake was found to be 0.2822 ± 0.0483 seconds. The
average change in reaction time was found to be -0.0078 ± 0.0069 seconds (Figure Three). As seen
in figure three, the standard error ranges do not overlap for the average reaction time changes for
the caffeine and non-caffeine male groups, which indicates a significant difference between the two.
For the female caffeine group, the average reaction time before beverage intake was found
to be 0.3067 ± 0.0366 seconds (n = 3) and after beverage intake was found to be 0.2787 ± 0.0278
seconds. The average change in reaction time was found to be -0.0280 ± 0.0135 seconds (Figure
Three). For the female non-caffeine group, the average reaction time before beverage intake was
found to be 0.2847 ± 0.0099 seconds (n = 3) and after beverage intake was found to be 0.2985 ±
0.0064 seconds. The average change in reaction time was found to be 0.0137 ± 0.0055 seconds
(Figure Three). As seen in figure three, the standard error ranges do not overlap for the average
reaction time changes for caffeine and non-caffeine female groups, which indicates a significant
Figure Three. Average change in reaction time for experimental subjects. Each value is based on an average of three replicates (three different individuals, n = 3). Error bars represent ± one standard error.Error bars do not overlap for caffeine and non-caffeine users in both male and female groups indicating significant differences between caffeine and non-caffeine groups. ECG Amplitude
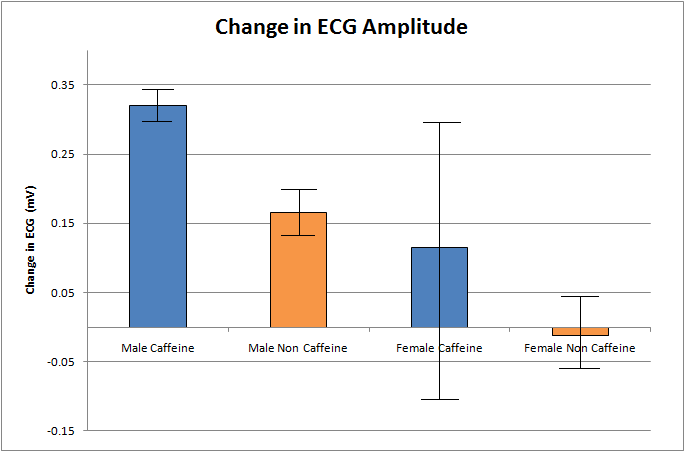
ECG amplitude is a measure of the depolarization that occurs within the heart during
contraction. Here it is believed that the greater the depolarization (thus greater ECG amplitude), the
greater the contraction resulting in increased cardiac output. For the male caffeine group, the
average ECG amplitude was 0.8948 ± 0.0560 mV (n = 3) before beverage intake and 1.2151 ±
0.0550 mV after beverage intake. This resulted in an average change in ECG amplitude of 0.3202 ±
0.0212 mV (Figure Four). For the non-caffeine male group, the average ECG amplitude before
beverage intake was 1.1016 ± 0.2454 mV (n = 3) and after beverage intake was found to be 1.2669
± 0.2253 mV. This resulted in an average change in ECG amplitude of 0.1653 ± 0.0440 mV
(Figure Four). As seen in figure four, the standard error ranges for the average changes in ECG
amplitude for the caffeine and non-caffeine groups do not overlap, which indicates a significant
For the female caffeine group, the average ECG amplitude was 0.7855 ± 0.0936 mV (n = 3)
before beverage intake and after beverage intake was found to be 0.9001 ± 0.1905 mV. The
resulting average change in ECG amplitude was found to be 0.1146 ± 0.2140 mV (Figure Four). In
the non-caffeinated female group, the average ECG amplitude before beverage intake was found to
be 0.7191 ± 0.0701 mV (n = 3) and after beverage intake was found to be 0.7073 ± 0.0562 mV.
This resulted in an average change in ECG amplitude of -0.0118 ± 0.0559 mV (Figure Four). As
seen in figure four, the standard error ranges for the average changes in ECG amplitude for caffeine
and non-caffeine female groups overlap, which indicates no significant difference between them.
`Figure Four. Average change in ECG amplitude for experimental subjects. Each value is based on an average of three replicates (three different individuals, n = 3). Error bars represent ± one standard error.Error bars do not overlap for caffeine and non-caffeine users in the male groups indicating significant differences between caffeine and non-caffeine groups. Error bars do overlap for caffeine and non-caffeine users in female groups indicating no significant differences between them. ECG QRS Complex Duration
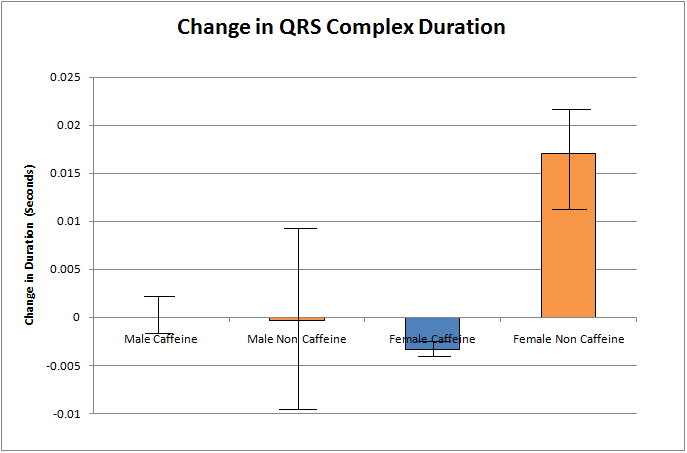
The QRS complex duration from an ECG trace represents approximately how long it takes
for the ventricles in the heart to become completely depolarized. Here this data is used to represent
the length of a heartbeat since a long duration would represent slower depolarization and thus a
slower heart beat duration and vice versa. For the caffeine male group, the average QRS complex
duration before beverage intake was found to be 0.0597 ± 0.0023 seconds (n = 3) and after beverage
intake was found to be 0.0597 ± 0.0037 seconds. This resulted in an average change in QRS
complex duration of 0.0000 ± 0.0021 seconds (Figure Five). For the non-caffeine male group, the
average QRS duration was found to be 0.0813 ± 0.0015 seconds (n = 3) and after beverage intake
was found to be 0.0810 ± 0.0085 seconds. This resulted in an average change in QRS complex
duration of -0.0003 ± 0.0084 seconds (Figure Five). As can be seen in figure five, the standard
error ranges for the average changes in QRS complex duration for caffeine and non-caffeine male
groups overlap, which indicates no significant difference between them.
For the female caffeine intake group, the average QRS complex duration before intake was
found to be 0.0650 ± 0.0026 seconds (n = 3) and after beverage intake was found to be 0.0617 ±
0.0030 seconds. This resulted in an average change in QRS complex duration of -0.0033 ± 0.0003
seconds (Figure Five) for the caffeine group. For the non-caffeine intake group, the average QRS
complex duration before intake was found to be 0.0620 ± 0.0020 seconds (n = 3) and after beverage
intake was found to be 0.0790 ± 0.0032 seconds. This resulted in an average change in the QRS
complex duration of 0.0170 ± 0.0051 seconds (Figure Five) for the non-caffeine group. As can be
seen in figure five, the standard error ranges for the average changes in QRS complex duration for
caffeine and non-caffeine females do not overlap, which indicates a significant difference between
Figure Five. Average change in QRS complex duration for experimental subjects. Each value is based on an average of three replicates (three different individuals, n = 3). Error bars represent ± one standard error.Error bars do not overlap for caffeine and non-caffeine users in the female groups indicating significant differences between caffeine and non-caffeine groups. Error bars do overlap for caffeine and non-caffeine users in male groups indicating no significant differences between them. EMG Mean Baseline
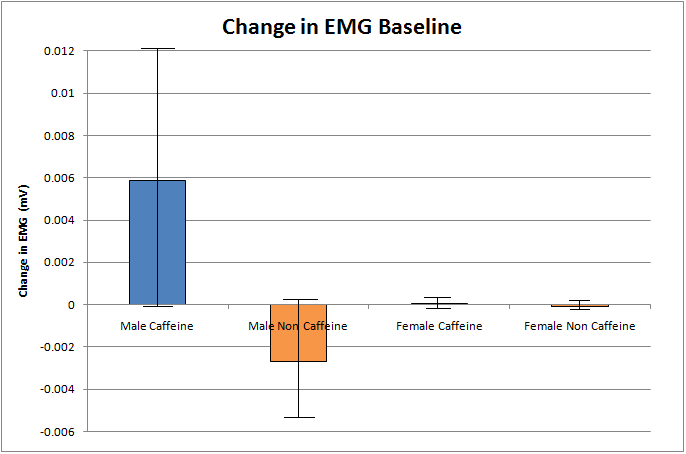
The EMG mean baseline is a measurement of the baseline level of motor activity that can be
measured for a particular subject. EMG measures the electrical activity of an individual which can
then be related to baseline levels of motor activity. For the male caffeine intake group, the mean
EMG baseline before beverage intake was found to be -0.0105 ± 0.0065 mV (n = 3) and after
beverage intake was found to be -0.0046 ± 0.0001 mV. The average change in EMG mean baseline
that resulted from this was found to be 0.0059 ± 0.0064 mV (Figure Six). For the non-caffeine male
group, the mean EMG baseline before beverage intake was found to be -0.0046 ± 0.0002 mV (n =
3) and following beverage intake was found to be -0.0073 ± 0.0028 mV. The resulting average
change in EMG mean baseline was -0.0027 ± 0.0028 mV (Figure Six). As can be seen in figure six,
the standard error ranges for the average changes in EMG mean baseline for caffeine and non-
caffeine groups overlap, which indicates no significant difference between them.
For the female caffeine group, the average EMG mean baseline before beverage intake was
found to be -0.0046 ± 0.0002 mV (n = 3) and after beverage intake was found to be -0.0046 ±
0.0001 mV. This resulted in an average change in EMG baseline of 0.0001 ± 0.0002 mV (Figure
Six). For the non-caffeine female group, average EMG baseline before beverage intake was found
to be -0.0046 ± 0.0001 mV (n = 3) and after beverage intake was found to be -0.0046 ± 0.0001 mV.
The resulting average change in EMG baseline was found to be -0.0001 ± 0.0001 mV (Figure Six).
As can be seen in figure six, the standard error ranges for the average changes in EMG mean
baseline for caffeine and non-caffeine females overlap, which indicates no significant difference
Figure Six. Average change in mean EMG baseline for experimental subjects. Each value is based on an average of three replicates (three different individuals, n = 3). Error bars represent ± one standard error.Error bars overlap for caffeine and non-caffeine users in both male and female groups indicating no significant differences. EMG Integrated Peak to Peak
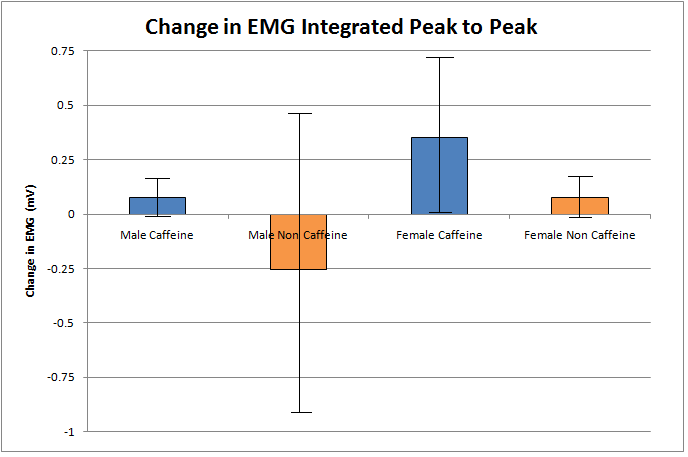
The EMG integrated peak to peak is a measurement of the motor activity that in this case
resulted from a simple reflex test of a particular subject. This measurement measures the electrical
activity of the individual that resulted from a reflex test which is then relatable to the motor activity
that has been stimulated. For the male caffeine group, the average peak to peak integrated value
before beverage intake was found to be 1.2133 ± 0.4330 mV (n = 3) and after beverage intake was
found to be 1.2896 ± 0.4936 mV. The average change in peak to peak integrated value was 0.0762
± 0.0980 (Figure Seven). For the non-caffeine male group, the average peak to peak integrated
value before beverage intake was found to be 1.4162 ± 0.3936 mV (n = 3) and after beverage intake
was found to be 1.1621 ± 0.2972 mV. The average change in peak to peak integrated value was -
0.2541 ± 0.6881 mV (Figure Seven). As can be seen in figure seven, the standard error ranges for
the average changes in integrated peak to peak values for caffeine and non-caffeine males overlap,
which indicates no significant difference between them.
For the female caffeine group, the average integrated peak to peak value before beverage
intake was found to be 0.6673 ± 0.2024 mV (n = 3) and after beverage intake was found to be
1.0206 ± 0.5072 mV. The average change in peak to peak integrated value was found to be 0.3533
± 0.3348 mV (Figure Seven). For the female non-caffeine group, the average integrated peak to
peak value before beverage intake was found to be 1.0522 ± 0.2071 mV (n = 3) and after beverage
intake was found to be 1.1275 ± 0.2928 mV. The average change in peak to peak integrated value
was found to be 0.0753 ± 0.1038 mV (Figure Seven). As can be seen in figure seven, the standard
error ranges for the average changes in integrated peak to peak values for caffeine and non-caffeine
females overlap, which indicates no significant difference between them.
Figure Seven. Average change in EMG integrated peak to peak for experimental subjects. Each value is based on an average of three replicates (three different individuals, n = 3). Error bars represent ± one standard error.Error bars overlap for caffeine and non-caffeine users in both male and female groups indicating no significant differences.
Discussion
To compare the non-caffeine group and the caffeine group for males and females, we
subtracted the observed value before beverage intake from the observed value after beverage intake
for each individual. We then averaged these changes to collect average values for changes in blood
pressure, reaction time, ECG amplitude, and EMG integrated peak-to-peak. To determine if there
were significant differences between non-caffeine and caffeine groups in males and females,
standard error ranges for measured changes in each value were calculated. Standard error ranges
which overlapped between caffeine and non- caffeine groups indicated data which was not
significant enough to reject the null hypothesis of no difference following caffeine consumption. A
lack of overlap would indicate a significant difference in the measured value.
For females, there was a significant difference in the QRS complex duration in the ECG
measurements, indicating that the heart changed pace following caffeine consumption. The reaction
time test also showed significant differences for females, as was expected. For males, the ECG
amplitude was significantly different from non-caffeinated groups to the caffeinated groups. This
could imply increased heart contraction among males as a result of caffeine consumption. The
reaction time for males also showed a significant difference between the two groups, which was
As previously stated, caffeine brings about physiological changes through its role as a
noncompetitive antagonist to A1 and A2A receptors. Through their interactions, there is an increase
in extracellular concentrations of dopamine, which leads to the stimulating affects of caffeine. The
implications of dopamine production are capable of explaining the decrease in reaction time for
males and females, decrease in QRS complex for females, and a decrease in male ECG amplitude
following caffeine consumption. These results show that female may not have as many A1 or A2
adenosine receptors compared to males. For the systolic blood pressure measurements, male
systolic blood pressure appears to increase regardless of what beverage was consumed. These
results imply that males may be more susceptible to the power of suggestion.
However, the average changes in blood pressure, as well as baseline and integrated EMG,
show that there is an overlap in the standard error ranges for both males and females. This indicates
that there is no significant difference between caffeine and non-caffeine groups for these measured
values. There were also no significant differences in QRS complex duration among male subjects
and for female subjects there were no significant differences in ECG amplitude. However, based on
previous studies’ strong evidence in showing that caffeine intake causes higher blood pressure, it
was concluded that the limitation of participants in the study likely affect the ability to analyze and
conclude causation effects in the data set. The lack of data in the study reflects upon the overlap of
standard deviations among males and females with and without caffeine consumption.
Regardless of the effects of caffeine consumption, other factors that may have contributed to the
trend in observations were considered. Such factors may include the participant’s genetic
disposition or physiological health problems. However, since the study was conducted using four
measurements, there is a greater probability that these results will directly correlate with the results.
It is difficult to isolate one predominant factor in this study since many variables may play a
contributing role in elevating blood pressure and increasing heart rate. Each group member had
conducted and researched how to collect the four measurements, thus the standard error in variation
between measurements was minimized. Thus, there were no problems with equipment usage. The
reaction time changed among caffeine and non-caffeine subjects, which was expected. This means
that the reaction time data was relevant data that showed a trend that was expected. This indicates
that the lack of differences in the other tests was due to lack of sample size instead of mechanical
error. The participants in the study remained in a separate area from the data collection and caffeine
preparation in order to reduce the chance of obtaining results due to the placebo effect. One problem
we faced is the amount of time the experiment requires. We did not anticipate that the experiment
would last as long as it did. We have solved this problem by staggering the testing of our subjects to
eliminate their waiting time after beverage consumption. Our study does not take into consideration
or record the participants’ previous consumption of caffeine in the past 24 hours. This lack of
completeness may skew the data due to prior exposure of the stimulant. We were not able to
account for test subjects that may have been habitual caffeine consumers. It is possible that they
already have a tolerance built up, which may have negatively affected the results in our experiment.
We attempted to prevent this problem by ensuring that subjects did not have caffeine two hours
before this experiment. However, this would not eliminate the problems raised due to the habitual
caffeine users. Future scientists may cope with limitations in the study by collecting preliminary
data based on the participant’s heath history and activity in the past 24-48 hours. A larger, more
randomized sample size would also lead to greater statistical power, decreased variability, and
reliably indicate that the observed significant changes in reaction time are caused by caffeine
References:
(1) Ferre, S. (2010, January). Role of the central ascending neurotransmitter systems in the
psychostimulant effects of caffeine [Electronic version]. Journal of Alzheimer's Disease, 20,
(2) Kennedy, D. O., & Haskell, C. F. (2011, March). Cerebral blood flow and behavioural effects
of caffeine in habitual and non-habitual consumers of caffeine: A near infrared spectroscopy
study. Biological Psychology, 86(3), 298-306. doi:10.1016/j.biopsycho.2010.12.010
(3) Temple, J. L., Dewey, A. M., & Briatico, L. N. (2010, December). Effects of acute caffeine
administration on adolescents. Experimental and Clinical Psychopharmacology, 18(6), 510-
(4) Weinberg, B. A., & Bealer, B. K. (2002). The world of caffeine: The science and culture of the world's most popular drug (pp. 166-193). New York, NY: Routledge.
(5) Yang, J., Chen, J., & Fredholm, B. B. (2009, January). Physiological roles of A1 and A2A
adenosine receptors in regulating heart rate, body temperature, and locomotion as revealed
using knockout mice and caffeine. American Journal of Physiology Heart and Circulatory Physiology, 296(4), 171-177. doi:10.1152/ajpheart.00754.2008
(6) “Reaction time test”. http://getyourwebsitehere.com/jswb/rttest01.html
(7) BioPac Student Lab Lessons 3.7.3. http://www.biopac.com.
M. Asif Mohiuddin, M.D. Orlando • 2880 S. Osceola Avenue • Orlando, FL 32806 Kissimmee • 901-CE. Oak Street • Kissimmee, FL 34744 St. Cloud • 3114 17th Street • St. Cloud, FL 34769 407-843-0443 • Fax: 407-847-0775 CONSENT FOR ESOPHAGOGASTRODUODENOSCOPY (EGD) Dr. M. Asif Mohiuddin is going to examine your esophagus, stomach and duodenum with a long flexible tube (e
 2.40 mmHg (Figure One). For non-caffeine males, the average systolic blood pressure before
beverage intake was 129.33 ± 6.36 mmHg (n = 3) and after beverage intake was 137.00 ± 5.51
mmHg. The average change in systolic blood pressure was 7.67 ± 3.17 mmHg (Figure One). As
seen in figure one, the standard error ranges overlap for the changes in systolic blood pressure for
caffeine and non-caffeine males indicating no significant difference between the two treatments.
For females in the study that were given caffeine, the average systolic blood pressure before
beverage intake was found to be 116.00 ± 5.85 mmHg (n = 3) and after beverage intake was found
to be 117.00 ± 4.58 mmHg. The average change in systolic blood pressure was 1.00 ± 3.06 mmHg
(Figure One). For non-caffeine females, the average systolic blood pressure before beverage intake
was 126.00 ± 3.06 mmHg (n = 3) and after beverage intake was found to be 123.67 ± 8.41 mmHg.
The average change in systolic blood pressure was -2.33 ± 6.17 mmHg (Figure One). As can be
seen in figure one, the standard error ranges overlap for the changes in systolic blood pressure for
caffeine and non-caffeine females indicating no significant difference between them.
2.40 mmHg (Figure One). For non-caffeine males, the average systolic blood pressure before
beverage intake was 129.33 ± 6.36 mmHg (n = 3) and after beverage intake was 137.00 ± 5.51
mmHg. The average change in systolic blood pressure was 7.67 ± 3.17 mmHg (Figure One). As
seen in figure one, the standard error ranges overlap for the changes in systolic blood pressure for
caffeine and non-caffeine males indicating no significant difference between the two treatments.
For females in the study that were given caffeine, the average systolic blood pressure before
beverage intake was found to be 116.00 ± 5.85 mmHg (n = 3) and after beverage intake was found
to be 117.00 ± 4.58 mmHg. The average change in systolic blood pressure was 1.00 ± 3.06 mmHg
(Figure One). For non-caffeine females, the average systolic blood pressure before beverage intake
was 126.00 ± 3.06 mmHg (n = 3) and after beverage intake was found to be 123.67 ± 8.41 mmHg.
The average change in systolic blood pressure was -2.33 ± 6.17 mmHg (Figure One). As can be
seen in figure one, the standard error ranges overlap for the changes in systolic blood pressure for
caffeine and non-caffeine females indicating no significant difference between them.
 (Figure Three). As seen in figure three, the standard error ranges do not overlap for the average
reaction time changes for caffeine and non-caffeine female groups, which indicates a significant
(Figure Three). As seen in figure three, the standard error ranges do not overlap for the average
reaction time changes for caffeine and non-caffeine female groups, which indicates a significant
 amplitude for the caffeine and non-caffeine groups do not overlap, which indicates a significant
For the female caffeine group, the average ECG amplitude was 0.7855 ± 0.0936 mV (n = 3)
before beverage intake and after beverage intake was found to be 0.9001 ± 0.1905 mV. The
resulting average change in ECG amplitude was found to be 0.1146 ± 0.2140 mV (Figure Four). In
the non-caffeinated female group, the average ECG amplitude before beverage intake was found to
be 0.7191 ± 0.0701 mV (n = 3) and after beverage intake was found to be 0.7073 ± 0.0562 mV.
This resulted in an average change in ECG amplitude of -0.0118 ± 0.0559 mV (Figure Four). As
seen in figure four, the standard error ranges for the average changes in ECG amplitude for caffeine
and non-caffeine female groups overlap, which indicates no significant difference between them.
amplitude for the caffeine and non-caffeine groups do not overlap, which indicates a significant
For the female caffeine group, the average ECG amplitude was 0.7855 ± 0.0936 mV (n = 3)
before beverage intake and after beverage intake was found to be 0.9001 ± 0.1905 mV. The
resulting average change in ECG amplitude was found to be 0.1146 ± 0.2140 mV (Figure Four). In
the non-caffeinated female group, the average ECG amplitude before beverage intake was found to
be 0.7191 ± 0.0701 mV (n = 3) and after beverage intake was found to be 0.7073 ± 0.0562 mV.
This resulted in an average change in ECG amplitude of -0.0118 ± 0.0559 mV (Figure Four). As
seen in figure four, the standard error ranges for the average changes in ECG amplitude for caffeine
and non-caffeine female groups overlap, which indicates no significant difference between them.
 For the female caffeine group, the average EMG mean baseline before beverage intake was
found to be -0.0046 ± 0.0002 mV (n = 3) and after beverage intake was found to be -0.0046 ±
0.0001 mV. This resulted in an average change in EMG baseline of 0.0001 ± 0.0002 mV (Figure
Six). For the non-caffeine female group, average EMG baseline before beverage intake was found
to be -0.0046 ± 0.0001 mV (n = 3) and after beverage intake was found to be -0.0046 ± 0.0001 mV.
The resulting average change in EMG baseline was found to be -0.0001 ± 0.0001 mV (Figure Six).
As can be seen in figure six, the standard error ranges for the average changes in EMG mean
baseline for caffeine and non-caffeine females overlap, which indicates no significant difference
For the female caffeine group, the average EMG mean baseline before beverage intake was
found to be -0.0046 ± 0.0002 mV (n = 3) and after beverage intake was found to be -0.0046 ±
0.0001 mV. This resulted in an average change in EMG baseline of 0.0001 ± 0.0002 mV (Figure
Six). For the non-caffeine female group, average EMG baseline before beverage intake was found
to be -0.0046 ± 0.0001 mV (n = 3) and after beverage intake was found to be -0.0046 ± 0.0001 mV.
The resulting average change in EMG baseline was found to be -0.0001 ± 0.0001 mV (Figure Six).
As can be seen in figure six, the standard error ranges for the average changes in EMG mean
baseline for caffeine and non-caffeine females overlap, which indicates no significant difference